
2026 Global Values Report · A global values survey
The Values-Living Gap
Findings from our global values survey: 9,656 people across 114 countries who completed the Values Institute Assessment between June 2025 and April 2026 — revealing the distance between what people say matters most and what they have the capacity to live.
Executive summary
Twelve findings at a glance
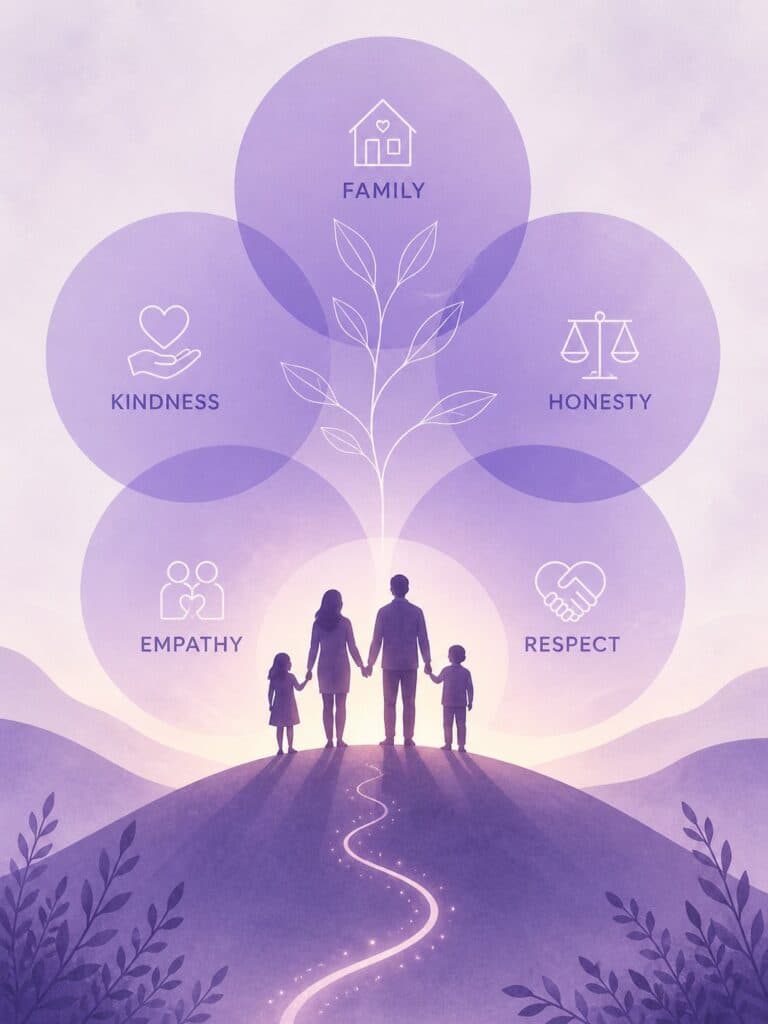
The world's top five values are Family, Respect, Kindness, Empathy, and Honesty.
Fewer than 5.4% place Wealth or Status in their top five.
Family is the #1 value across every age group, gender, and country.
Gen Z values Family more than any other generation (43%).
One in four people with high values clarity are also highly stressed.
26% of Family-valuers are too exhausted and disconnected to be present for the people they love.
Women report higher stress than men across every age group.
One in four women aged 35–44 is severely exhausted; women are roughly twice as likely to show compound anxiety indicators.
Purpose is the strongest buffer against stress.
As purpose clarity rises from 1 to 7, stress drops by 25% and fulfillment more than doubles.
Gratitude is the value most consistently associated with higher wellbeing.
Lower stress, higher purpose, higher fulfillment — yet only 14% include it in their top five.
Prioritizing Fairness is associated with the lowest wellbeing of any value group.
Possibly the emotional toll of sustained concern for injustice without sufficient recovery.
Under stress, values contract inward. When resourced, they expand outward.
Anxiety doesn't change what people believe — it changes what they can act on.
Fulfillment barely increases across the working lifespan.
Decades of career advancement do not measurably increase fulfillment until retirement.
Family is the clearest common anchor across countries.
What follows it reveals distinct cultural fingerprints.
Thriving individuals are meaning-centered, gender-balanced, and grateful.
They disproportionately value Family, Respect, and Gratitude. They are not escaping — they are building.
For many people, the next challenge is not values discovery — it is capacity.
Knowing what matters and being able to live it are different things.
Foreword
This report began with a simple question: what do people actually value?
Over the past year, 9,656 people across 114 countries completed the Values Institute Assessment. They selected the values that matter most to them, told us how stressed they feel, how clear they are on their values and purpose, and how fulfilled they are. A majority also completed a detailed wellbeing assessment covering energy, connection, and mindset.
What we expected was an interesting snapshot of human priorities. What we found was something more uncomfortable. When given the opportunity to reflect, people are remarkably consistent about what matters: Family, Respect, Kindness, Empathy, Honesty — across every generation, gender, and country in the dataset. Wealth and Status barely register.
But many of the people who feel clear on their values cannot live them. They are too exhausted. Too stressed. Too disconnected from the present moment. The gap between knowing and doing is real, and it is widespread.
Values clarity is necessary. It is not sufficient. That gap — the Values-Living Gap — is the subject of this report.

Brad Hook
Founder, Values Institute · Author, Start With Values (Penguin/Hatherleigh, 2025)
Part 1
When people reflect, they are remarkably clear on what matters
Asked to select their five most important values from a list of 48, respondents converged on a strikingly consistent set. The top five are entirely relational and moral — dominated by how we treat each other and the bonds we form.
Exhibit 1
The world's top ten values
Share of respondents placing each value in their top five
Source: Values Institute Global Values Report 2026 · values layer, n = 9,656
Family is the clearest point of consensus in the entire dataset — the #1 value in every generation, every gender, and every country with sufficient sample size.
Nearly one in four people (23.2%) rank Family as their single most important value. The next closest — Kindness, at 6.9% — sits at less than a third of that level.
The culture gap
In a culture that relentlessly promotes achievement, visibility, and financial success as the markers of a life well-lived, the values people actually choose tell a different story. Society rewards one set of priorities. People report living for another.
Exhibit 2
The values culture celebrates, people rarely choose
Share of respondents placing each value in their top five — same 0–40% scale as Exhibit 1
Fewer than 5.4% of respondents place Wealth or Status in their top five. Less than 1% choose Status at all.
Source: Values Institute Global Values Report 2026 · values layer, n = 9,656
The generational story we got wrong
Gen Z — the generation routinely characterized as disconnected — values Family more than any other generation. They also rate Love significantly higher (25.4% vs the 16.7% average) and Friendship at more than double the rest of the population (29.1% vs 13.9%). Theirs is the only generation where connection outranks meaning as the dominant motivator.
Exhibit 3
Family in the top five, by age
Share of each age bracket including Family among their five most important values
Source: Values Institute Global Values Report 2026 · values layer, n = 9,656
There is a tension in the Gen Z profile: they also rate Wealth (9.6% vs 4.0%), Achievement (19.0% vs 15.0%), and Physical Fitness (13.2% vs 9.0%) higher than average. They appear to want deep relationships and material success simultaneously — the generation of and. Meanwhile Curiosity (8.7%) and Collaboration (4.0%) run strikingly low against roughly 18% and 13% for everyone else. Whether that reflects developmental stage or a genuine generational shift is a question the data raises but cannot answer.
The arc of a life, told in values
As people age, a clear motivational arc emerges. Achievement-oriented motivation falls from 25.2% in Gen Z to 8.3% in Boomers, while meaning-centered motivation more than doubles, from 20.5% to 44.8%.
Fairness nearly doubles across the lifespan (14.3% to 28.3%). Kindness, Honesty, and Spirituality climb steadily. Love follows a U-curve — high in Gen Z (25.4%), suppressed during the middle years of career and logistics (15.0%), rising again in the Boomers (18.9%).
We begin wanting to belong and succeed. Over time, we let go of achievement and reach for meaning. The question is whether younger generations must wait decades to make that shift — or whether the transition can be supported earlier.
Part 2
Many people lack the capacity to live their values
Before beginning the values selection, respondents rated their own values clarity on a 1–7 scale. The average was 4.49 — above the midpoint. Many people arrive already feeling reasonably clear on what matters. The uncomfortable finding is what sits alongside that clarity.
Clarity is not a shield. It may even sharpen the pain of misalignment — the clearer you are on what matters, the more acutely you feel the gap when you cannot live by it.
The wellbeing picture
Among the 6,231 respondents who completed the nine-dimension wellbeing assessment, the two lowest-scoring dimensions are rest (3.88/7, with 20.9% severely exhausted) and presence (3.61/7, with 24.5% very disconnected). The highest are empathy (5.79) and support (5.64). People are skilled at caring for others — and significantly less skilled at sustaining themselves.
Among people who place Family in their top five, the gap is stark:
One in four people who say Family is what matters most are too depleted to show up fully for the people they love — physically there, mentally elsewhere.
Convergent validation — two measures, one story
The self-reported check-in and the wellbeing assessment tell the same story through independent measures. Among people reporting both high values clarity and high stress, average rest is 3.59 and presence 3.63 — well below the population means. Among those with high clarity but low stress, rest rises to 4.90 and presence to 4.16. Two measurement approaches converge on the same finding: knowing what matters and having the capacity to live by it are different things.
Women are carrying a disproportionate burden
Women report higher stress than men in every age group (3.76 vs 3.45 average; 27.2% vs 22.4% at high stress). The wellbeing data deepens the picture: women outscore men on empathy (5.86 vs 5.67) and support (5.68 vs 5.63) — and score lower on every other dimension.
Exhibit 4
The gender wellbeing gap
Average score by dimension (1–7 scale)
Source: Values Institute Global Values Report 2026 · wellbeing layer, n = 6,231
22.4% of women are severely exhausted (rest ≤ 2), compared to 16.0% of men. Women also report lower purpose clarity (3.98 vs 4.29) and lower fulfillment (3.98 vs 4.08). The pattern is consistent across self-reported and independently measured data: a gender that has cultivated extraordinary care for others while systematically depleting its own reserves.
Exhibit 5
The gender-anxiety gap persists across the lifespan
Share showing compound anxiety indicators — rest, clarity, and presence all ≤ 3
Source: Values Institute Global Values Report 2026 · wellbeing layer, n = 6,231 · proxy indicator, not a clinical diagnosis
The 35–44 pressure point
Women aged 35–44 are the most affected group in the entire dataset: 28.1% report high stress, 24.6% are severely exhausted, and 20.9% show compound anxiety indicators. Their #1 value is Family (24.7%). They know exactly what matters. They are running out of the capacity to live by it.
Men and the Family connection
Among men with low wellbeing, 21.3% name Family as their #1 value. Among men with high wellbeing, that rises to 33.6% — a 12.3-point jump, the largest value-wellbeing shift for any gender group. The data cannot tell us whether valuing Family helps men thrive or thriving men are freer to prioritize Family, but the association is striking.
Part 3
The path forward
Purpose: the strongest buffer
The relationship between purpose clarity and both stress and fulfillment is the most linear gradient in the entire dataset. As purpose rises, stress falls and fulfillment climbs — in near-lockstep.
Exhibit 6
As purpose clarity rises, stress falls and fulfillment more than doubles
Average self-reported stress and fulfillment at each level of purpose clarity (all 1–7 scales)
View the data
| Purpose clarity | Avg. stress | Avg. fulfillment |
|---|---|---|
| 1 | 4.12 | 2.15 |
| 2 | 4.04 | 2.93 |
| 3 | 3.91 | 3.38 |
| 4 | 3.68 | 3.96 |
| 5 | 3.53 | 4.61 |
| 6 | 3.35 | 5.13 |
| 7 | 3.07 | 5.41 |
Source: Values Institute Global Values Report 2026 · check-in layer, n = 9,327
Purpose is not a luxury. It may be foundational infrastructure for managing the demands of modern life.
The gratitude effect
Within this dataset, Gratitude is the value most consistently associated with higher wellbeing — people who include it in their top five score higher on every single wellbeing dimension, and report lower stress (3.54 vs 3.70), higher purpose clarity (4.32 vs 4.01), and higher fulfillment (4.30 vs 3.95). When Gratitude is someone's #1 value, overall wellbeing rises to 5.15 — the highest of any value group. Yet only 14.4% of respondents include it at all.
Exhibit 7
Gratitude-valuers score higher on every wellbeing measure
Average score, respondents with vs without Gratitude in their top five (1–7 scales)
The relationship likely runs in both directions — Gratitude may support wellbeing, and wellbeing may make Gratitude more accessible. The association is the strongest and most consistent of any single value in the dataset.
Source: Values Institute Global Values Report 2026 · wellbeing layer, n = 6,231
The fairness paradox
In this sample, prioritizing Fairness is associated with the lowest wellbeing of any value group (4.52 vs 4.69 overall), alongside higher stress, lower purpose clarity, and lower fulfillment. Fairness + Respect as a top-two pairing produces the lowest wellbeing of any common combination (4.00/7).
This does not suggest that caring about justice makes you miserable. One interpretation: sustained concern for injustice — seeing the persistent gap between how things are and how they should be — carries a psychological cost, particularly without sufficient recovery. The people most attuned to what is wrong in the world may need more recovery, not less concern. Notably, Fairness nearly doubles from Gen Z (14.3%) to Boomers (28.3%): the awareness of injustice appears to accumulate across a lifetime — and so, potentially, does its toll.
How values shift under stress
One of the most striking patterns in the data is the way values shift between anxious and calm states. Across every generation, the same directional pattern emerges.
More prominent under anxiety
The sphere of concern contracts inward
- Peace
- Kindness
- Empathy
- Creativity
- Autonomy
- Curiosity
More prominent when calm & resourced
Values expand outward, toward contribution
- Family
- Respect
- Teamwork
- Leadership
- Collaboration
- Gratitude
- Resilience
- Achievement
The shifts are substantial. In Gen Z, Peace drops from 21.7% under anxiety to 6.9% when calm. In Millennials, Teamwork jumps from 2.5% under anxiety to 16.6% when calm — a sixfold increase.
Anxiety does not appear to change what people believe in. It changes what they have the capacity to act on.
This has a direct implication for anyone leading a family, a team, or an organization: if you want people to show up with leadership, collaboration, and resilience, you cannot simply ask for it. You must first build the conditions — rest, presence, energy, clarity — that make those values accessible. You cannot lead from empty. This feedback loop is the mechanism behind the Values-Living Gap: when energy drops, the values that require surplus become inaccessible. People don't stop believing in them. They simply can't reach them.
The fulfillment plateau
Exhibit 8
Fulfillment barely moves across the working lifespan
Average self-reported fulfillment by age (1–7 scale)
Source: Values Institute Global Values Report 2026 · check-in layer, n = 9,327
People do not feel progressively more fulfilled as they advance through their careers. Only the 65+ group shows a meaningful uptick — and even then, the shift is modest. This challenges the assumption that career advancement and material accumulation produce fulfillment. In this sample, they do not appear to.
Deeper looks
Beneath the headline findings
A portrait of thriving — the 100 people who close the gap
One hundred individuals — 1.6% of wellbeing respondents — scored 6 or higher on all nine wellbeing dimensions. They show us what it looks like when the Values-Living Gap closes.
Their values: Family (20.8%), Respect (15.6%), Love (8.3%), Gratitude (5.2%) — Gratitude at more than three times the rate of the general population.
Their motivation: meaning-centered (39.6%), with achievement close behind (22.9%). Freedom-seeking drops to just 10.4%. Thriving people are not trying to escape their lives. They are building within them.
Their gender: almost perfectly balanced (49% male, 47% female) — strikingly different from the 66/26 split in the overall sample. Their age: concentrated in the 25–44 range. Thriving is not reserved for retirement; it is accessible during the most demanding years.
The struggling group — 17 individuals scoring ≤ 3 on all dimensions — presents a mirror image. Their #1 value: Fairness (23.5%). They see the world clearly. They lack the resources to sustain their engagement with it.
Values across cultures — Family is universal; what follows it is not
Family appears in the top five in every country with sufficient sample size — from the United States (43.2%) to Germany (23.3%). It is the closest thing in this dataset to a universal human priority. What comes after it reveals strikingly different cultural identities. The six English-speaking nations (n = 7,245) lead with Family (39%), Kindness (31%), Respect (30%), Honesty (25%), and Empathy (25%) — but diverge sharply within.
United Kingdom n = 3,552
The most Fairness-oriented country in the dataset (30.4% vs the 22.2% global average). Kindness also runs high (34.7%); Love sits at just 10.4% — roughly a third of the US rate. A prosocial, justice-oriented profile: collective decency, fair play, and kindness.
United States n = 3,083
The mirror image. Love dominates (27.6% — nearly three times the UK rate) and Spirituality is prominent (15.0% vs 4.3% in the UK), while Fairness drops to 12.5% and Collaboration to 5.8% (vs the UK's 18.2%). Personally expressive and faith-influenced.
Australia & New Zealand n = 539
Both share high Family rates but differ in flavor. Australia stands out on Balance (17.4%) and Courage (11.6%). New Zealand leads on Creativity (23.6%) and Physical Fitness (15.7%) — the outdoors-creative identity of Aotearoa.
Continental Europe n = 383
Freedom-seeking is the dominant motivation (30.5%) — the only region where it outranks meaning. Germany (n=75) is the most distinctive: Curiosity 34.2% (nearly double the global average), Learning 32.9%, Autonomy 24.7%. Family, at 23.3%, is the lowest of any country with adequate sample size.
Asia-Pacific n = 381
The Philippines (n=309) is the standout: Respect dominates at 57.8% — the highest single-value rate for any country — with Teamwork (26.6%) and Collaboration (25.3%) at roughly three times global rates. It also reports the highest wellbeing in the dataset (6.05 vs 4.65 global), likely reflecting both genuine cultural factors and response norms. India (n=72) leans toward Empathy (31.4%), Learning (27.1%), and Peace (21.4%).
Middle East & Africa n = 162
The most meaning-centered region (42.1%). South Africa (n=59) leads on Wisdom (25.0%) and Spirituality (23.2%).
These are not better or worse value systems. They are cultural fingerprints. For organizations operating across borders, the implication is practical: a values-based program that resonates in London may need reframing for New York or Manila. The universal language is Family. Everything else requires cultural translation.
Explore the data
Pick a value. See how the world holds it.
The exhibits above tell the story we found. This panel lets you interrogate the same dataset yourself — how common each value is worldwide, where it runs unusually high or low, and how it behaves under stress.
Pick a value
37.4%
of 9,656 people worldwide place Family in their top five values
Scale 0–40%, shared with Exhibit 1
More accessible when people feel calm and resourced — one of the values stress crowds out.
Where it stands out
- The #1 value in every age group, gender and country in the dataset
- Gen Z ranks it highest of any generation (43.0%)
- Lowest in Germany (23.3%) — the lowest of any country with adequate sample size
Family in the top five, by age
Scale 0–50%
Source: Global Values Report 2026, values layer (n=9,656). Country figures reflect the regional samples described in the methodology; wellbeing and stress associations come from the check-in and wellbeing layers.

Founder commentary
Brad’s interpretation of the findings — clearly distinguished from the data itself.
One possible interpretation of these findings is this: if most people across cultures still value Family, Respect, Kindness, Empathy, and Honesty more than Wealth, Status, and Authority, then perhaps humanity’s deepest values are not broken. What may be broken is our capacity to live by them.
That could help explain one of the central contradictions of modern life: why societies filled with people who say they value love, fairness, and decency can still produce so much conflict, disconnection, and harm. Not because people are hypocrites — because they are depleted.
Over two decades of working with individuals and organizations — from PwC, Bridgestone, and Electronic Arts to frontline teams and families under pressure — I have seen the same pattern. When people run on frayed nervous systems, chronic overload, and too little recovery, they become less present, less patient, less generous, and less able to act in alignment with what they say matters most. They do not lose their values. They lose access to them.
We are not confused about what matters. We are depleted.
If that interpretation is directionally right, then the path to a better future is not only moral or ideological. It is physiological, emotional, relational, and cultural. We need to invest in the things that sound unglamorous but may be foundational: rest, nervous-system regulation, recovery, connection, presence, clarity, and meaning. Not as self-care luxuries — as infrastructure for values-aligned living.
When people are rested, they are kinder. When they are present, they are better parents. When they have clarity, they can lead. When they feel connected, they collaborate. When they have purpose, they contribute beyond themselves. The data suggests that wellbeing is not separate from values. It may be the very thing that makes values liveable.
Values without wellbeing are aspirations. Values with wellbeing are a way of life.
— Brad Hook
Conclusion
Closing the gap
This report set out to ask what people value. The answer is clear and, in many ways, hopeful: family, respect, kindness, empathy, and honesty — not wealth, status, or authority. The moral compass of this sample points in a direction most of us would be proud of.
But values clarity, however important, is only the beginning. Many of the people who hold these values cannot fully live them. They are too tired, too scattered, too stretched — a gap that is real, measurable, and confirmed by independent measures within this dataset. The people most affected are women, particularly in the 35–44 sandwich years. The value most associated with depletion is Fairness; the value most associated with flourishing is Gratitude — a resource that remains dramatically underutilized. And the strongest buffer, for stress and fulfillment alike, is purpose.
The question is no longer “what do we value?” The question is: “do we have the capacity to live it?”
Get started
Practices from the data
Not generic wellness advice — practices anchored to the biggest depletions and the strongest protective factors this dataset identified.
For individuals
Build a gratitude practice
Gratitude is the value most consistently associated with higher wellbeing in the dataset — yet only 14% include it in their top five. Three things you appreciated, written down before sleep or named at the dinner table, is one of the lowest-effort, highest-return interventions available.
Clarify your purpose
Purpose was the strongest buffer against stress in the entire dataset. Spending time articulating what your work and life are for is not indulgent — it may be foundational.
Protect rest like infrastructure
Rest was among the lowest-scoring wellbeing dimensions, and exhaustion was strongly associated with the inability to live one's values. Build genuine recovery into your week — not just sleep, but unstructured time, time outdoors, and time without screens.
Regulate your nervous system
Anxiety doesn't change what you believe; it changes what you can act on. Slow breathing, cold exposure, daily movement, and contemplative practices train the nervous system to recover faster from stress.
For your team
Run weekly "what went well" check-ins
Begin team meetings by inviting each person to share something that went well or that they appreciated. This builds the gratitude effect at scale.
Build in micro-breaks
Sustained depletion fragments the values people can express. Five-minute pauses between meetings, walking one-on-ones, and protected lunch breaks are the conditions under which collaboration and leadership become accessible.
Name shared values explicitly
Teams that articulate their values publicly are more likely to live by them. Pick three to five team values together, and reference them in decisions.
Make purpose visible
Connect daily work to a clear why. The purpose-stress gradient in this dataset suggests the same dynamic operates inside organizations as in individual lives.
Useful companions: the values-based mindfulness practice, values-based micro-habits, and the Decision Matrix.
The study
Sample, instruments & methodology
Between June 2025 and April 2026, 9,656 individuals completed the Values Institute Assessment at app.values.institute. The assessment collects three layers of data: values selection and ranking (9,656 respondents), a four-item self-reported check-in administered before values selection (9,327), and a nine-dimension wellbeing assessment (6,231; 6,175 completed both).
The sample spans 114 countries — the largest groups from the United Kingdom (36.8%), United States (31.9%), Australia (3.5%), the Philippines (3.2%), and Canada (2.3%). Two-thirds of respondents (65.7%) are female, 26.0% male, with the remainder selecting non-binary, other, or preferring not to say. The largest age cohort is 35–44 (27.6%).
Assessment design
The Values Institute Assessment (v3) employs a structured multi-stage instrument. Respondents first select values within four thematic categories (Belonging, Growth, Impact, Fulfillment — 12 values per category, 48 total), choosing up to three per category. This categorical pre-selection reduces choice overload and ensures representation across value domains. Respondents then rank their aggregated selections, from which the top five are extracted for analysis. Values archetypes (8 types) and motivation styles (4 types) are assigned algorithmically from the distribution and composition of selections.
Instruments — wellbeing module & check-in
The wellbeing module comprises nine items across three clusters — Energy (vitality, fitness, rest), Connection (positivity, empathy, support), and Mindset (focus, clarity, presence) — each on a 1–7 scale anchored from “Very Poor” to “Excellent,” framed as self-assessments of current state.
The check-in comprises four items administered early in the flow, before values selection: stress, values clarity, purpose clarity, and fulfillment, each on 1–7 scales. This sequencing means the values clarity score (average 4.49/7) reflects how clear respondents feel before the structured discovery process — an independent subjective layer that can be cross-validated against the wellbeing dimensions.
Analytical approach
All analyses are descriptive and correlational. No inferential statistics or significance testing have been applied, as the sample is self-selected and non-probabilistic, rendering traditional p-values potentially misleading. Primary analyses include frequency analysis, cross-tabulation against wellbeing and check-in variables using tercile and quartile splits, composite proxy indicators for burnout (rest, vitality, and positivity all ≤ 3) and anxiety (rest, clarity, and presence all ≤ 3), value-pair analysis, stress-state comparison within generational cohorts, and convergent validation across the 6,175 respondents who completed both layers. Proxy indicators are analytical constructs, not validated clinical instruments.
Limitations & cautions
Self-selection bias: respondents chose to take a values assessment, likely overrepresenting reflective, self-improvement-oriented individuals. Findings about values clarity should be interpreted in this context — though when even the most values-motivated people show a significant gap between stated values and lived capacity, the finding is arguably more concerning, not less.
Gender composition: the sample is roughly two-thirds female; gender findings are reported as within-group comparisons to mitigate composition effects.
Cultural response styles:cross-national wellbeing comparisons may reflect cultural response tendencies as well as genuine differences — the Philippines’ notably high scores likely reflect both.
Causality: all relationships are correlational. The Gratitude-wellbeing association, for instance, may run in either direction or reflect shared underlying factors. No causal claims are made. Where we offer interpretation, we name it as such.
For researchers & media
Cite this research
Suggested citation
Values Institute (2026). The Global Values Report 2026: The Values-Living Gap. Hook, B. (Ed.). https://values.institute/global-values-report-2026
Journalists and researchers are welcome to cite this report with attribution. This data also underpins our open letter to superintelligence, A Letter to the Intelligence We Made. For methodology questions, data queries, or interview requests, contact hello@values.institute.
Where do you sit in the data?
The report describes the species. The free assessment describes you — your top five values in about three minutes, no sign-up required.